March 29, 2021
As a National Cancer Institute (NCI)-designated cancer center, The University of Kansas Cancer Center must define and prioritize research, cancer control and education and outreach efforts specific to the region we serve. This means we must first have a deep understanding of the cancer issues in the community we serve, our catchment area, and then develop tailored solutions. The cancer center’s catchment area encompasses western Missouri and the entire state of Kansas. About 25 percent of the population lives in rural communities. The composition of these rural communities is becoming more and more diverse, with increased racial/ethnic minority representation.
“Our region is transforming,” said Dinesh Pal Mudaranthakam, director of research information technology. “In order to strategically focus research and outreach efforts, we must better understand catchment area trends related to health behaviors, cancer incidence and mortality, population demographics and access to care.”
To help, cancer center members built a data platform to streamline the process of synthesizing data about Kansas and Missouri demographics, cancer risk factors and incidence, and mortality rates. The data tool called Organize and Prioritize Trends to Inform KU Cancer Center (OPTIK), retrieves cumulative and raw data from numerous sources to build a comprehensive view of health patterns. The KU Cancer Center team leveraged support from longtime collaborative partners, including the Kansas and Missouri Cancer Registries, Kansas Department of Health and Environment, Missouri Department of Health, Children’s Mercy, Senior Services and Centers for Disease Control and Prevention, to ensure data represented all communities in the catchment area.
OPTIK standardizes these diverse data sources to synthesize the cancer burden at local, regional and national levels, while upholding patient privacy. The OPTIK database enables researchers to use available data and create heat maps and other visualizations to aid in funding proposals and research activities.
“To understand the data synthesized from OPTIK and what it means to our catchment area, we partner with the cancer center’s Community Advisory Board, our researchers and others. These stakeholders inform the direction of our research focus and outreach efforts,” said Ronald Chen, MD, MPH, Brandmeyer Chair and professor of the department of radiation oncology and associate director for health equity.

Pinpointing disparities
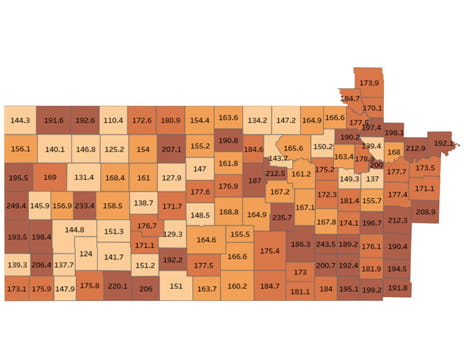
Some groups experience cancer disproportionately. Researchers can zero in on disparity trends using data through OPTIK and gain insight to develop research proposals.
For example, OPTIK data reveal many counties in our catchment area have higher cancer mortality rates than the national average. OPTIK mapped the mortality rates of colorectal cancer in our catchment area, revealing some counties have higher rates when compared to overall Kansas and Missouri rates. From there, it was determined that education and screening efforts should concentrate specifically on African American and rural populations. With the data to support their proposal, researchers at the cancer center received an National Cancer Institute grant to support a community health educator focused on addressing barriers to colorectal cancer screening and clinical trial participation among African Americans.
Sharing data discoveries
Data are available to scientists who request information for the development of funding proposals, presentations, posters and manuscripts. Without OPTIK, it would fall to the researcher to explore multiple sources of non-standardized data to develop a research proposal. By offering a single source of vetted data that is easily accessible, OPTIK allows scientists to spend more of their time creating well-informed, more impactful research endeavors.
Furthermore, sharing OPTIK-generated data with our partners, including the Community Advisory Board, stimulates discussions about disparities, resources, and gaps, guiding the cancer center's priorities.
While OPTIK has already supported the formation of several projects, the team, which includes members of the cancer center’s Biostatistics and Informatics Shared Resource, plans to keep growing the database and adding more sources to help develop further nuanced insights into catchment area trends.
“The needs of our catchment area are ever-evolving,” said Hope Krebill MSW, BSN, RN, executive director of the Masonic Cancer Alliance. “Data-driven planning in partnership with our communities helps us reach individuals most affected by cancer.”
Dinesh Pal Mudaranthakam, Lisa M Harlan-Williams, Roy A Jensen, Hanluen Kuo, Vandita Garimella, Ronald C Chen, Matthew S Mayo, Hope Krebill, OPTIK: a database for understanding catchment areas to guide mobilization of cancer center assets, Database, Volume 2020, 2020, baaa054, https://doi.org/10.1093/database/baaa054